Read the expanded article on datascienceplus.com
A frusterating task actuaries frequently encounter is combining data from separate excel files in order to create aggregate loss development triangles. Using only Excel, the common method is to create links between the excel files which must be updated manually at each new evaluation. This is prone to human error and is time consuming. Using a SQL-like script with R we can automate this process to save time and reduce the liklihood of making a mistake.
For a definition of a loss development triangle and why they are important, see Wikipedia.
Example of conventional, linked triangle:
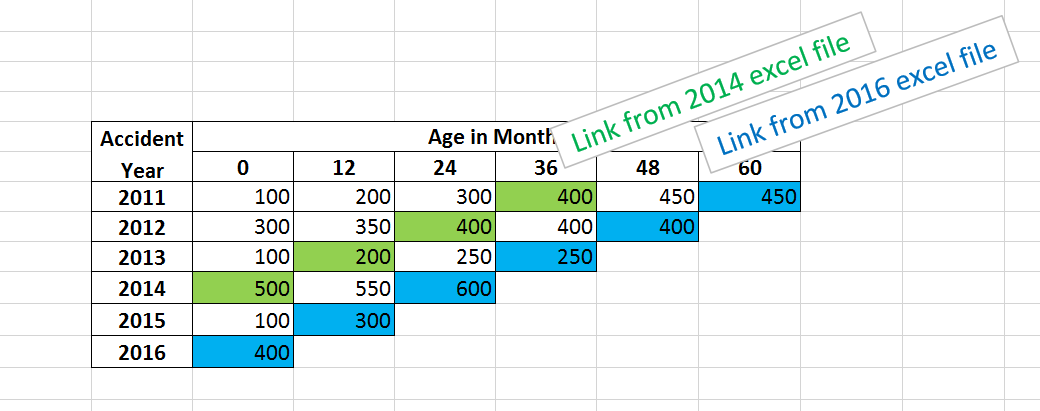
Conventional Excel Method:
- Go into each excel file and calculate the data needed (e.g., paid loss net of deductible).
- Go into each excel file and summarise these values with a pivot table.
- Go into each excel file and create a link from these pivot tables to an additional file.
- Repeat this process for each variable needed (e.g., incurred loss net of deductible, case reserves, etc)
There is zero scalability in the above process: if there were 100 excel files, this above process would be 100 times as time-consuming.
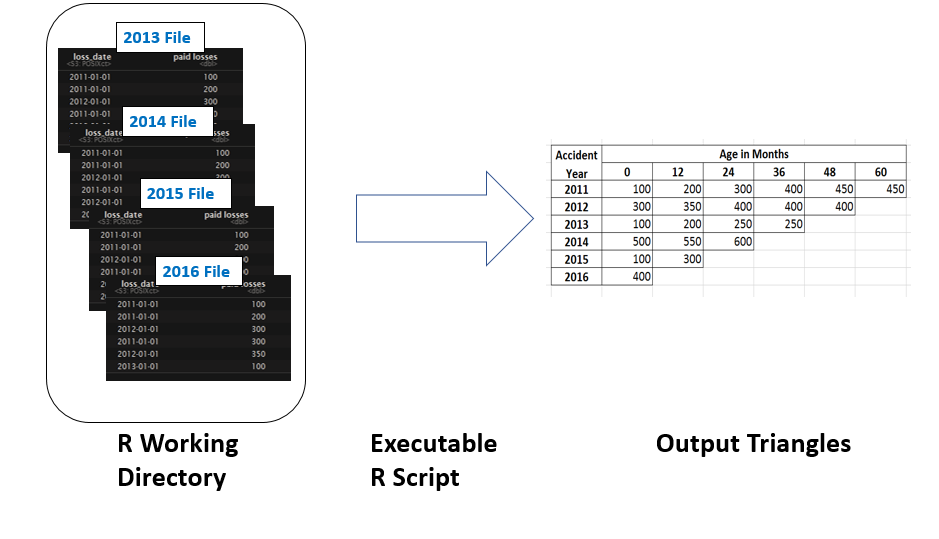
R Extract Method:
- Organize the excel files.
- Write a script to load the files from Excel into the R working directory.
- Combine the data first, and then ouput a single triangle file.
This process is completely scalable.
Example of R extract method:
When it comes to aggregating excel files, R can be faster and more consistent than linking together each of the excel files, and once this script is set in place, making modifications to the data can be done easily by editing a few lines of code. The only manual labor required in excel was to go into each file and rename the columns to be consistent.
Comments