When most people think of machine learning, the main emphasis is on usually on making predictions or or data mining. Anomaly detection, or outlier classification, is a third major use for many types of models. In a nutshell, this process detects sudden or drastic shifts in a process. For instance, bank managers can be alerted of fraud if an account suddenly experiences abnormal activity, or website owners can track trending content in real-time.
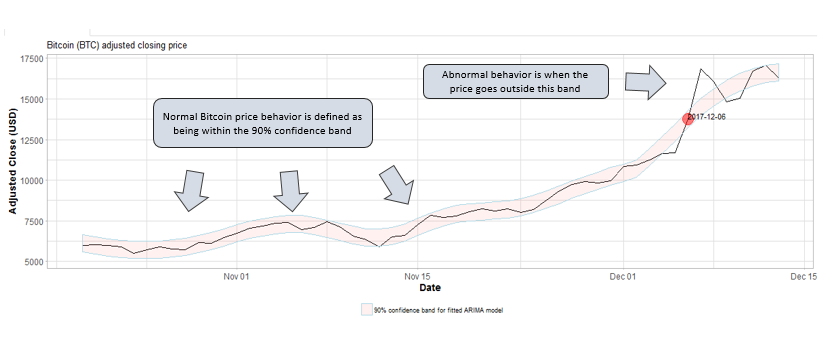
This Shiny application identifies anomalous behavior in the Bitcoin Price Index (BTC-USD). Additionally, follow along with the notebook file for this article.
Methods
- Transformation to approximately stationary time series
- Fit ARIMA model
- Classify outliers
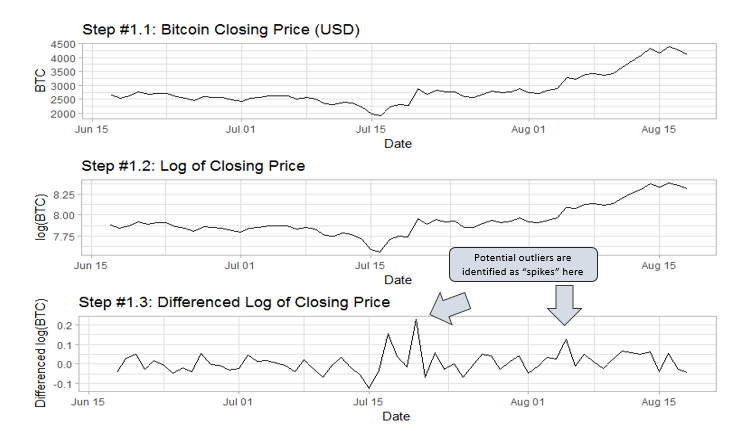
Step 1: Transformation
The time series is first transformed with a natural logarithm to stabilize the variance, and is then differenced to eliminate trend. This can be a simple single differencing, or a more sophistocated seasonal differencing or fractional differencing.
Step 2: Model Fitting
Once the series is transformed, the model-fitting process would begin. In a more sophistocated example, considerations would need to be made in order for an ARIMA model to be a logical choice, such as heteroscedasticity, deterministic time trends, one-time anomalies, and known predictor variables. For Bitcoin, this is not always the case as of November 2017.
These models are far from perfect, but do not need be. The purpose is not for prediction, but to merely identify abnormal price behavior. For short time periods, the model is often a moving average MA(1), AR(1), or ARMA(1,1) model of the differenced log of the closing price. Over longer time intervals, more complex models allow for greater sensitivity to price fluctuations.
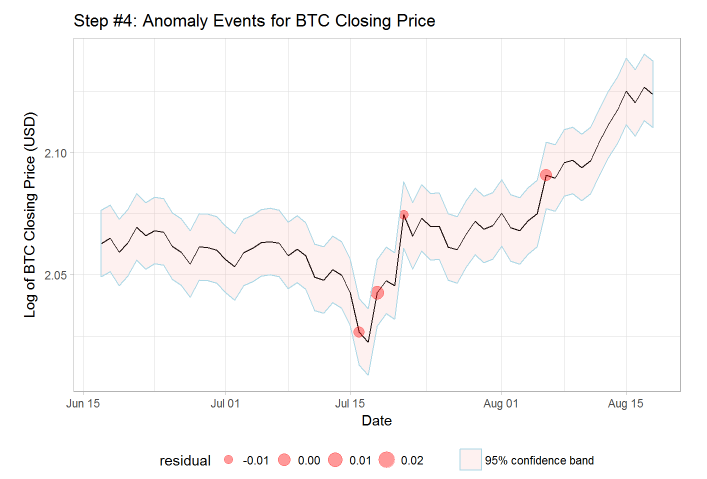
Step 3: Outlier Classification
Once the model is fit, points are classified as being outliers or not. In this app, the user specifies a risk tolerance level alpha, between 0.01 and 0.1, which serves as this cutoff. If the standardized residual is above the cutoff, then the point is an outlier. The lower the threshold, the higher the sensitivity. As seen below, the points which originally appeared to be suspect are classified in red as anomalies.
Comments